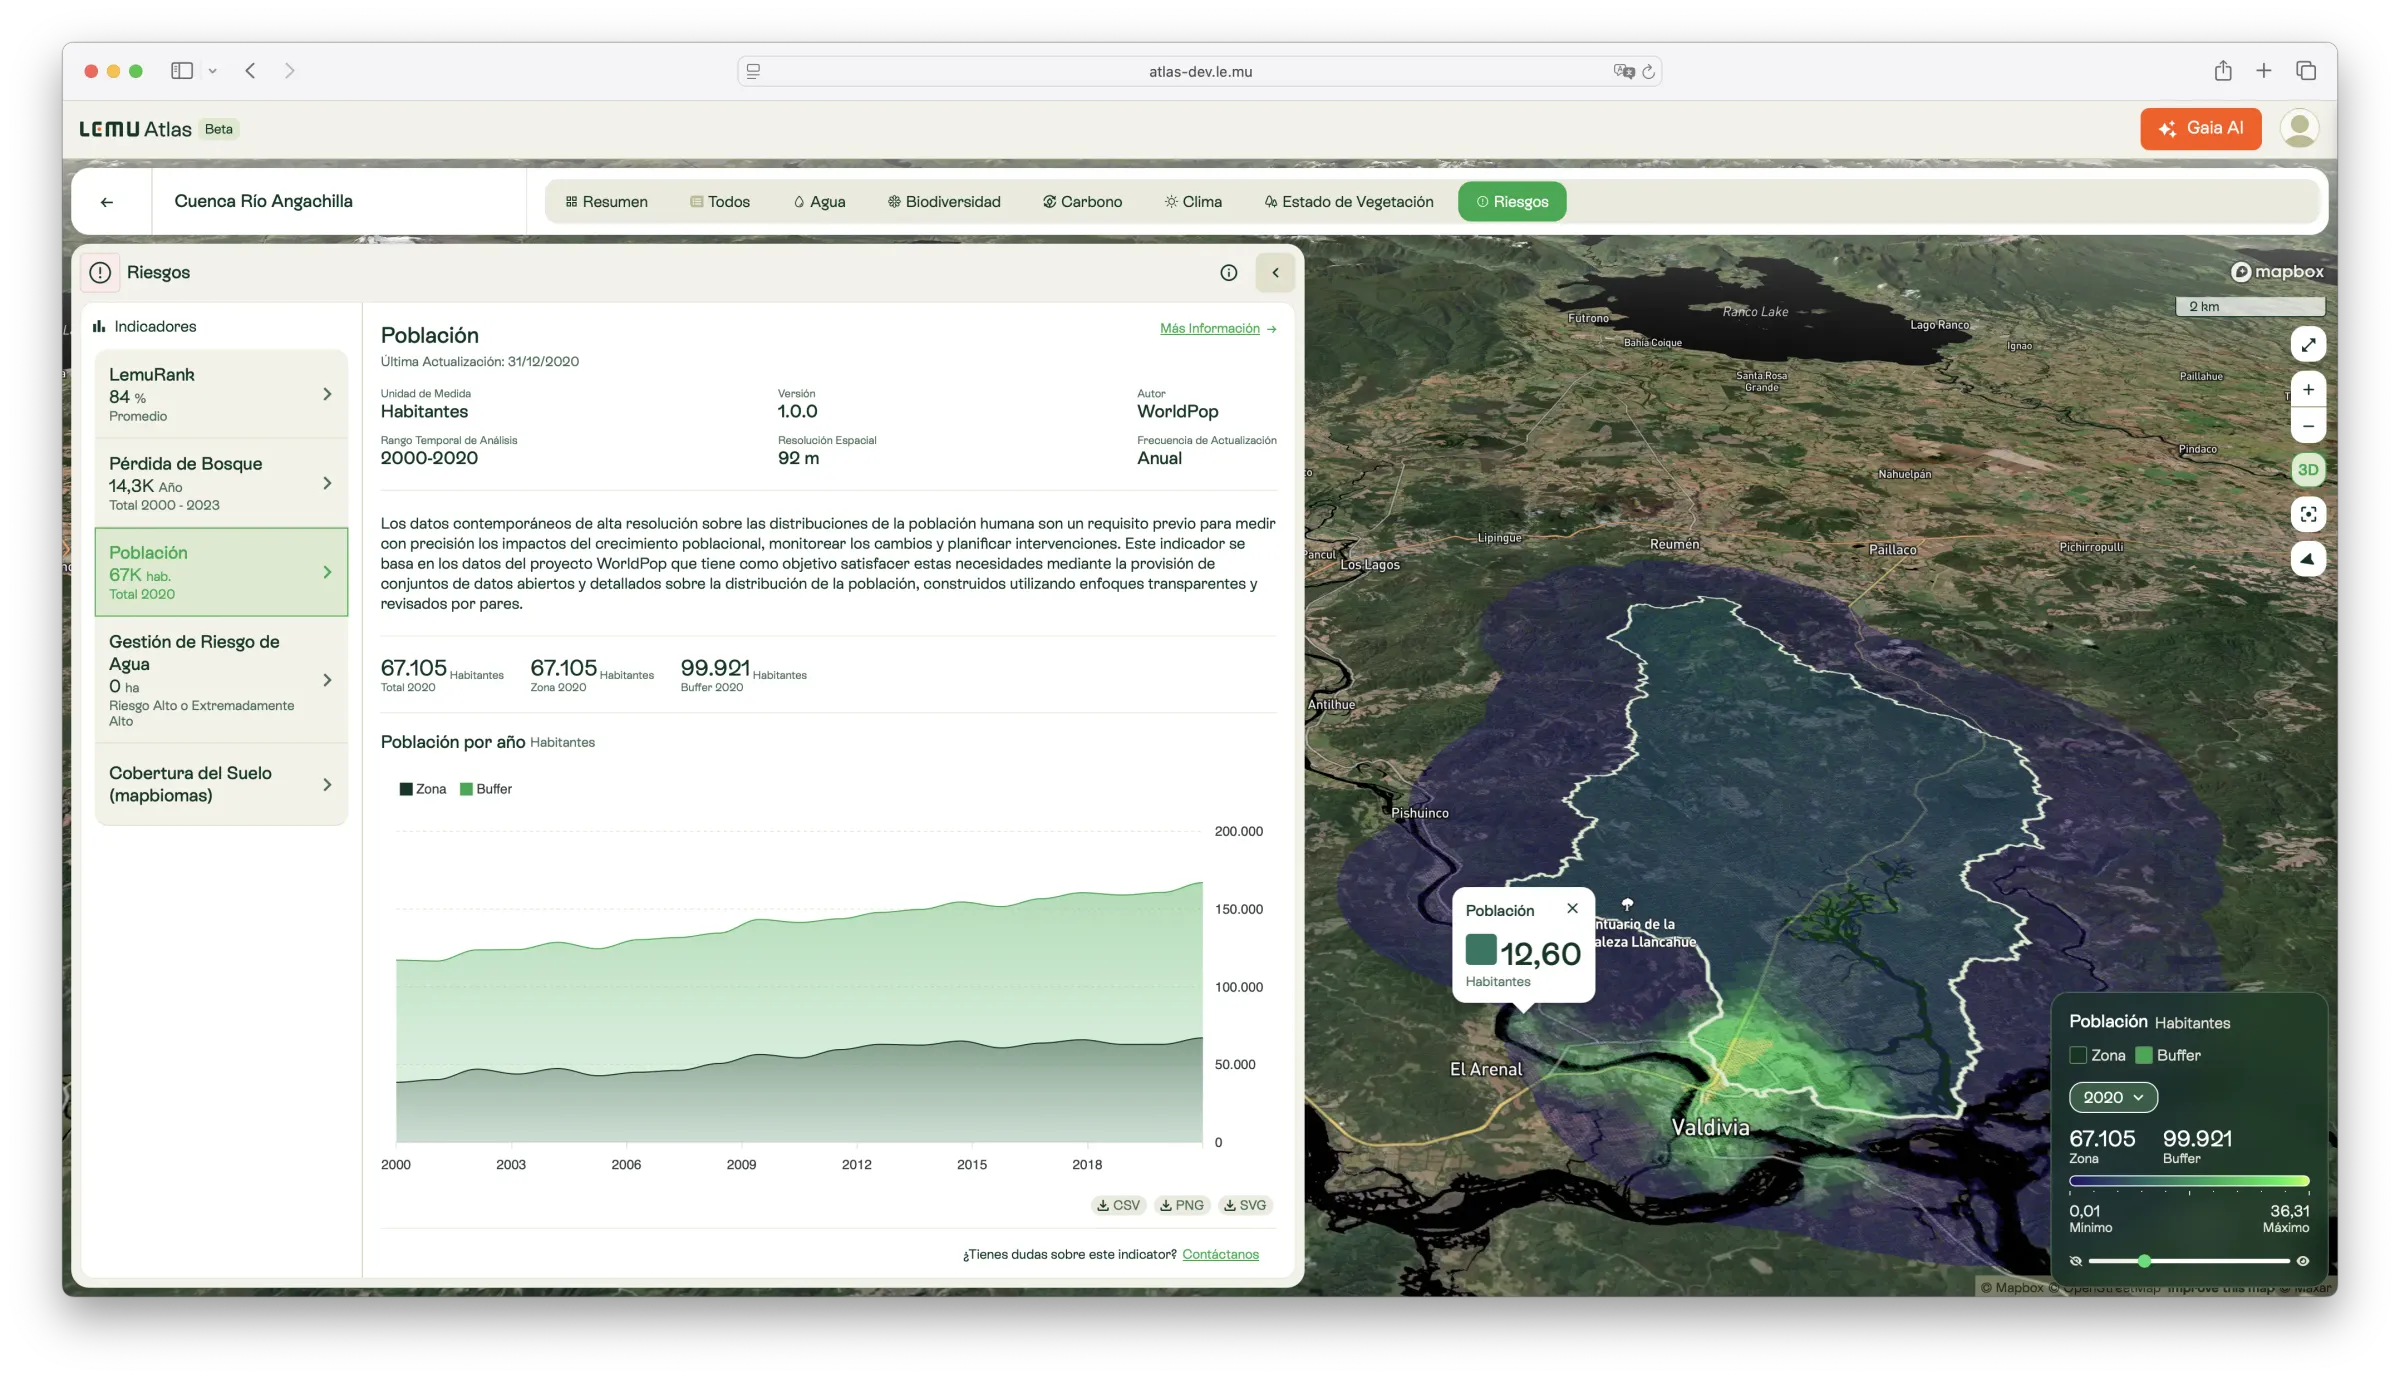
Population
High-resolution gridded estimates of human population distribution, derived from census data and ancillary variables, available annually since 2000.

Description
This indicator provides estimates of the number of people living within a given area, expressed in inhabitants. The dataset is developed by the WorldPop project, which integrates global census data with ancillary variables such as elevation, land cover, and built infrastructure to redistribute census counts at high resolution.
By applying advanced statistical methods and dasymetric mapping, WorldPop generates consistent gridded population datasets. These allow monitoring of human population dynamics at scales relevant for conservation, planning, and ecosystem impact analysis.
What it measures
- Number of inhabitants per grid cell.
- Spatial distribution of human populations.
- Annual changes in population density since 2000.
How to interpret
- Higher values: denser populations, often near urban or peri-urban areas.
- Lower values: sparsely populated or uninhabited regions.
- Useful as a pressure indicator when combined with biodiversity, carbon, or vegetation data.
Unit / Scale
Inhabitants (count).
Temporal coverage: 2000–2020.
Spatial resolution: 92–100 m.
Update frequency: Annual.
Author / Source
WorldPop.
🔗 https://www.worldpop.org
📄 Sorichetta, A., Hornby, G. M., Stevens, F. R., Gaughan, A. E., Linard, C., & Tatem, A. J. (2015). High-resolution gridded population datasets for Latin America and the Caribbean in 2010, 2015, and 2020. Scientific Data, 2(1), 1–12.
Applications in Atlas
- Assess human pressure on ecosystems and biodiversity.
- Support land-use planning and sustainable development.
- Integrate population data into conservation prioritisation and risk analysis.
- Monitor changes in human settlement patterns over time.